Forex
2.00
Опубликовано June 01, 2026
AUDNZD B
Купить
BUY
Цена входа
1.2010
Сведения о сигнале
Направление
Купить
Цена входа
1.2010
Риск:Вознаграждение
1:1.5
Торговые уровни
Технический график
Анализ рынка
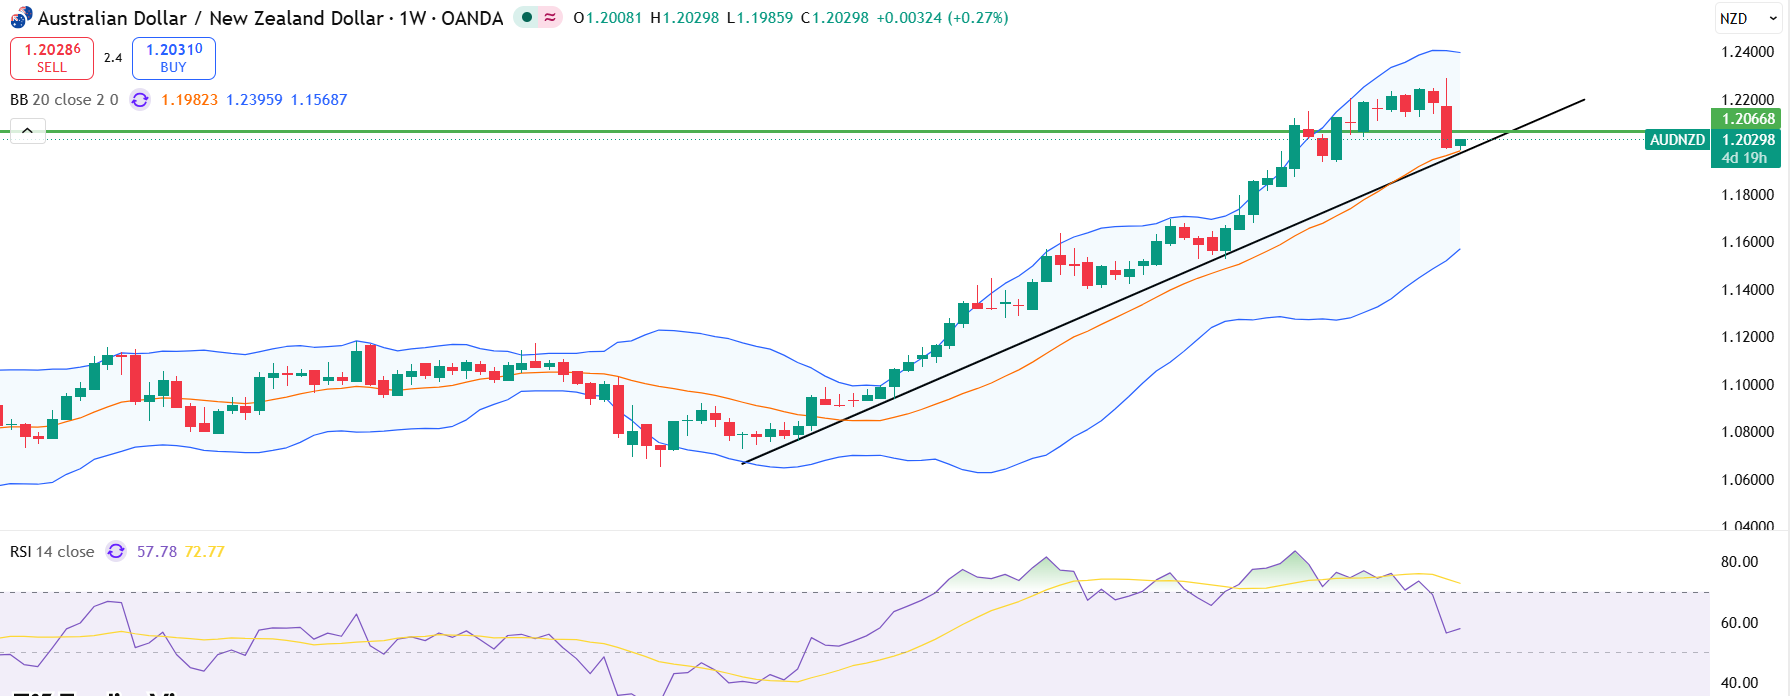
AUD/NZD is back above 1.2000, reflecting a recent rebound from lower support levels. The overall structure suggests a pause and consolidation after forced selling, rather than a lower trend continuation.
Key Indicators
Technically, the momentum remains bearish, with the price far below the 200/100-hour moving average. However, the pair makes new lows, while MACD/RSI produces higher lows, indicating that sellers are losing confidence, which frequently leads to a short-term bounce.
Fundamental Context
After a sharp decline last week, AUDNZD managed to catch its breath on Monday morning. This dramatic fall followed the Reserve Bank of New Zealand's unexpected shift towards a more hawkish stance, surprising the markets.
Предупреждение о риске
The RSI rebounded from oversold levels, indicating that selling pressure has subsided; a strong positive recovery follow-through remains to be confirmed. The main tendency is negative, and the current rise may be a typical bull trap.
Другие анализы рынка
Изучайте больше профессиональных технических анализов на разных рынках и таймфреймах.
USDCAD
Продать
Цена входа
1.4225
Сроки
3.00
Опубликовано June 24, 2026
Dollar Index
Продать
Цена входа
101.5500
Сроки
3.00
Опубликовано June 24, 2026
EURUSD
Купить
Цена входа
1.1360
Сроки
3.00
Опубликовано June 24, 2026
Gold
Продать
Цена входа
4125.0000
Сроки
2.00
Опубликовано June 23, 2026
AUDNZD
Продать
Цена входа
1.2230
Сроки
2.00
Опубликовано June 23, 2026
EURJPY
Продать
Цена входа
184.4000
Сроки
2.00
Опубликовано June 23, 2026